Handling Data - Venn Diagrams
A Venn Diagram is a way of visually representing sets of items or numbers by using their logical relationships to decide how they should be grouped together. A Venn Diagram uses overlapping circles to show the relationships between the groups. The section of the circles which overlap contain numbers that have properties pertaining to both of the circles.
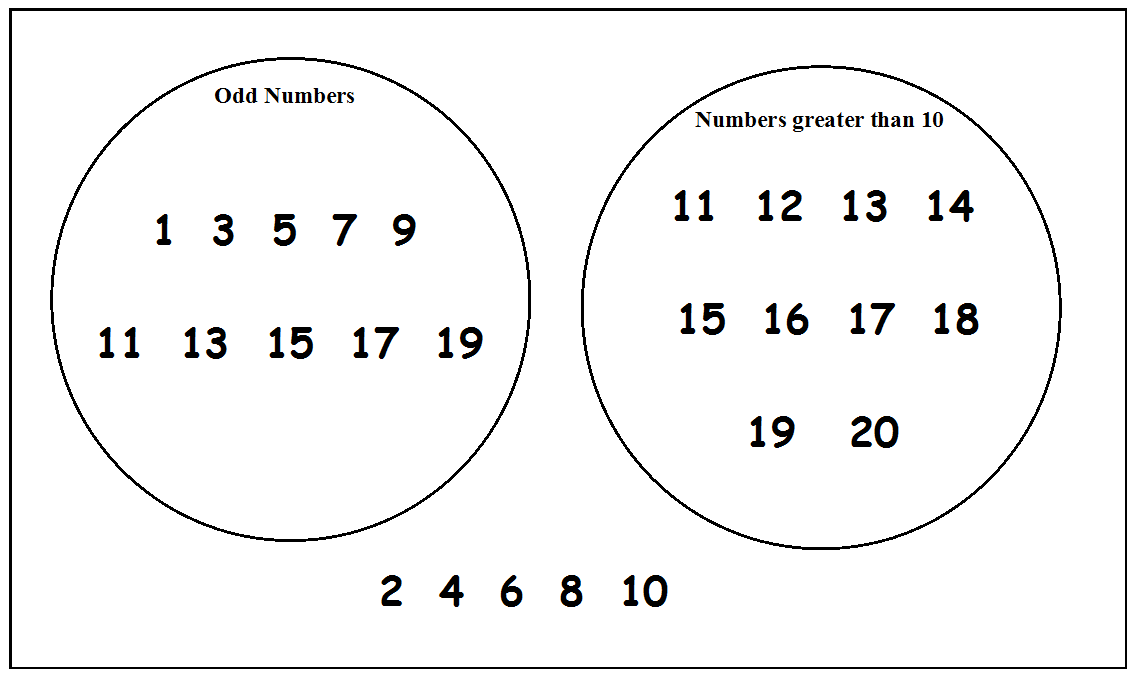
Lets look at an example using the numbers 1 to 20 and two sets.
Odd numbers and numbers greater than 10.

All the odd numbers are grouped in one circle and all the numbers over 10 are grouped in the other. The remaining numbers do not qualify for either circle so are left outside.
Notice that there some numbers that appear in both circles because they qualify for both.
They are odd but also greater than 10. (11, 13, 15, 17, 19)

By overlapping the circles, the area enclosed contains the numbers that qualify for both sets, they are odd and greater than 10. The remaining numbers do not qualify for either so are left outside.

Venn Diagrams can be used to categorise more than two sets of data. This Venn diagram has three sets - Children with blonde hair, boys and over eight years old.
Sam falls into all three categories as he is a boy, is older than eight and has blonde hair. Ian is a boy and is older than eight but does not have blonde hair. Julie and Sally have blonde hair but are younger than eight and are girls. Becky is younger than eight and does not have blonde hair so does not fulfil any of the matching criteria, so her name is left outside the circles but still included in the frame of the venn diagram.
Ask questions about each child to ensure that your child can interpret the data.
|
